Examples of data visualizations made by me

California sea lion study
Poster on organochlorine contaminant study in California sea lions won second place in the 2014 Wildlie Disease Association conference.
Tanzania bat tracking
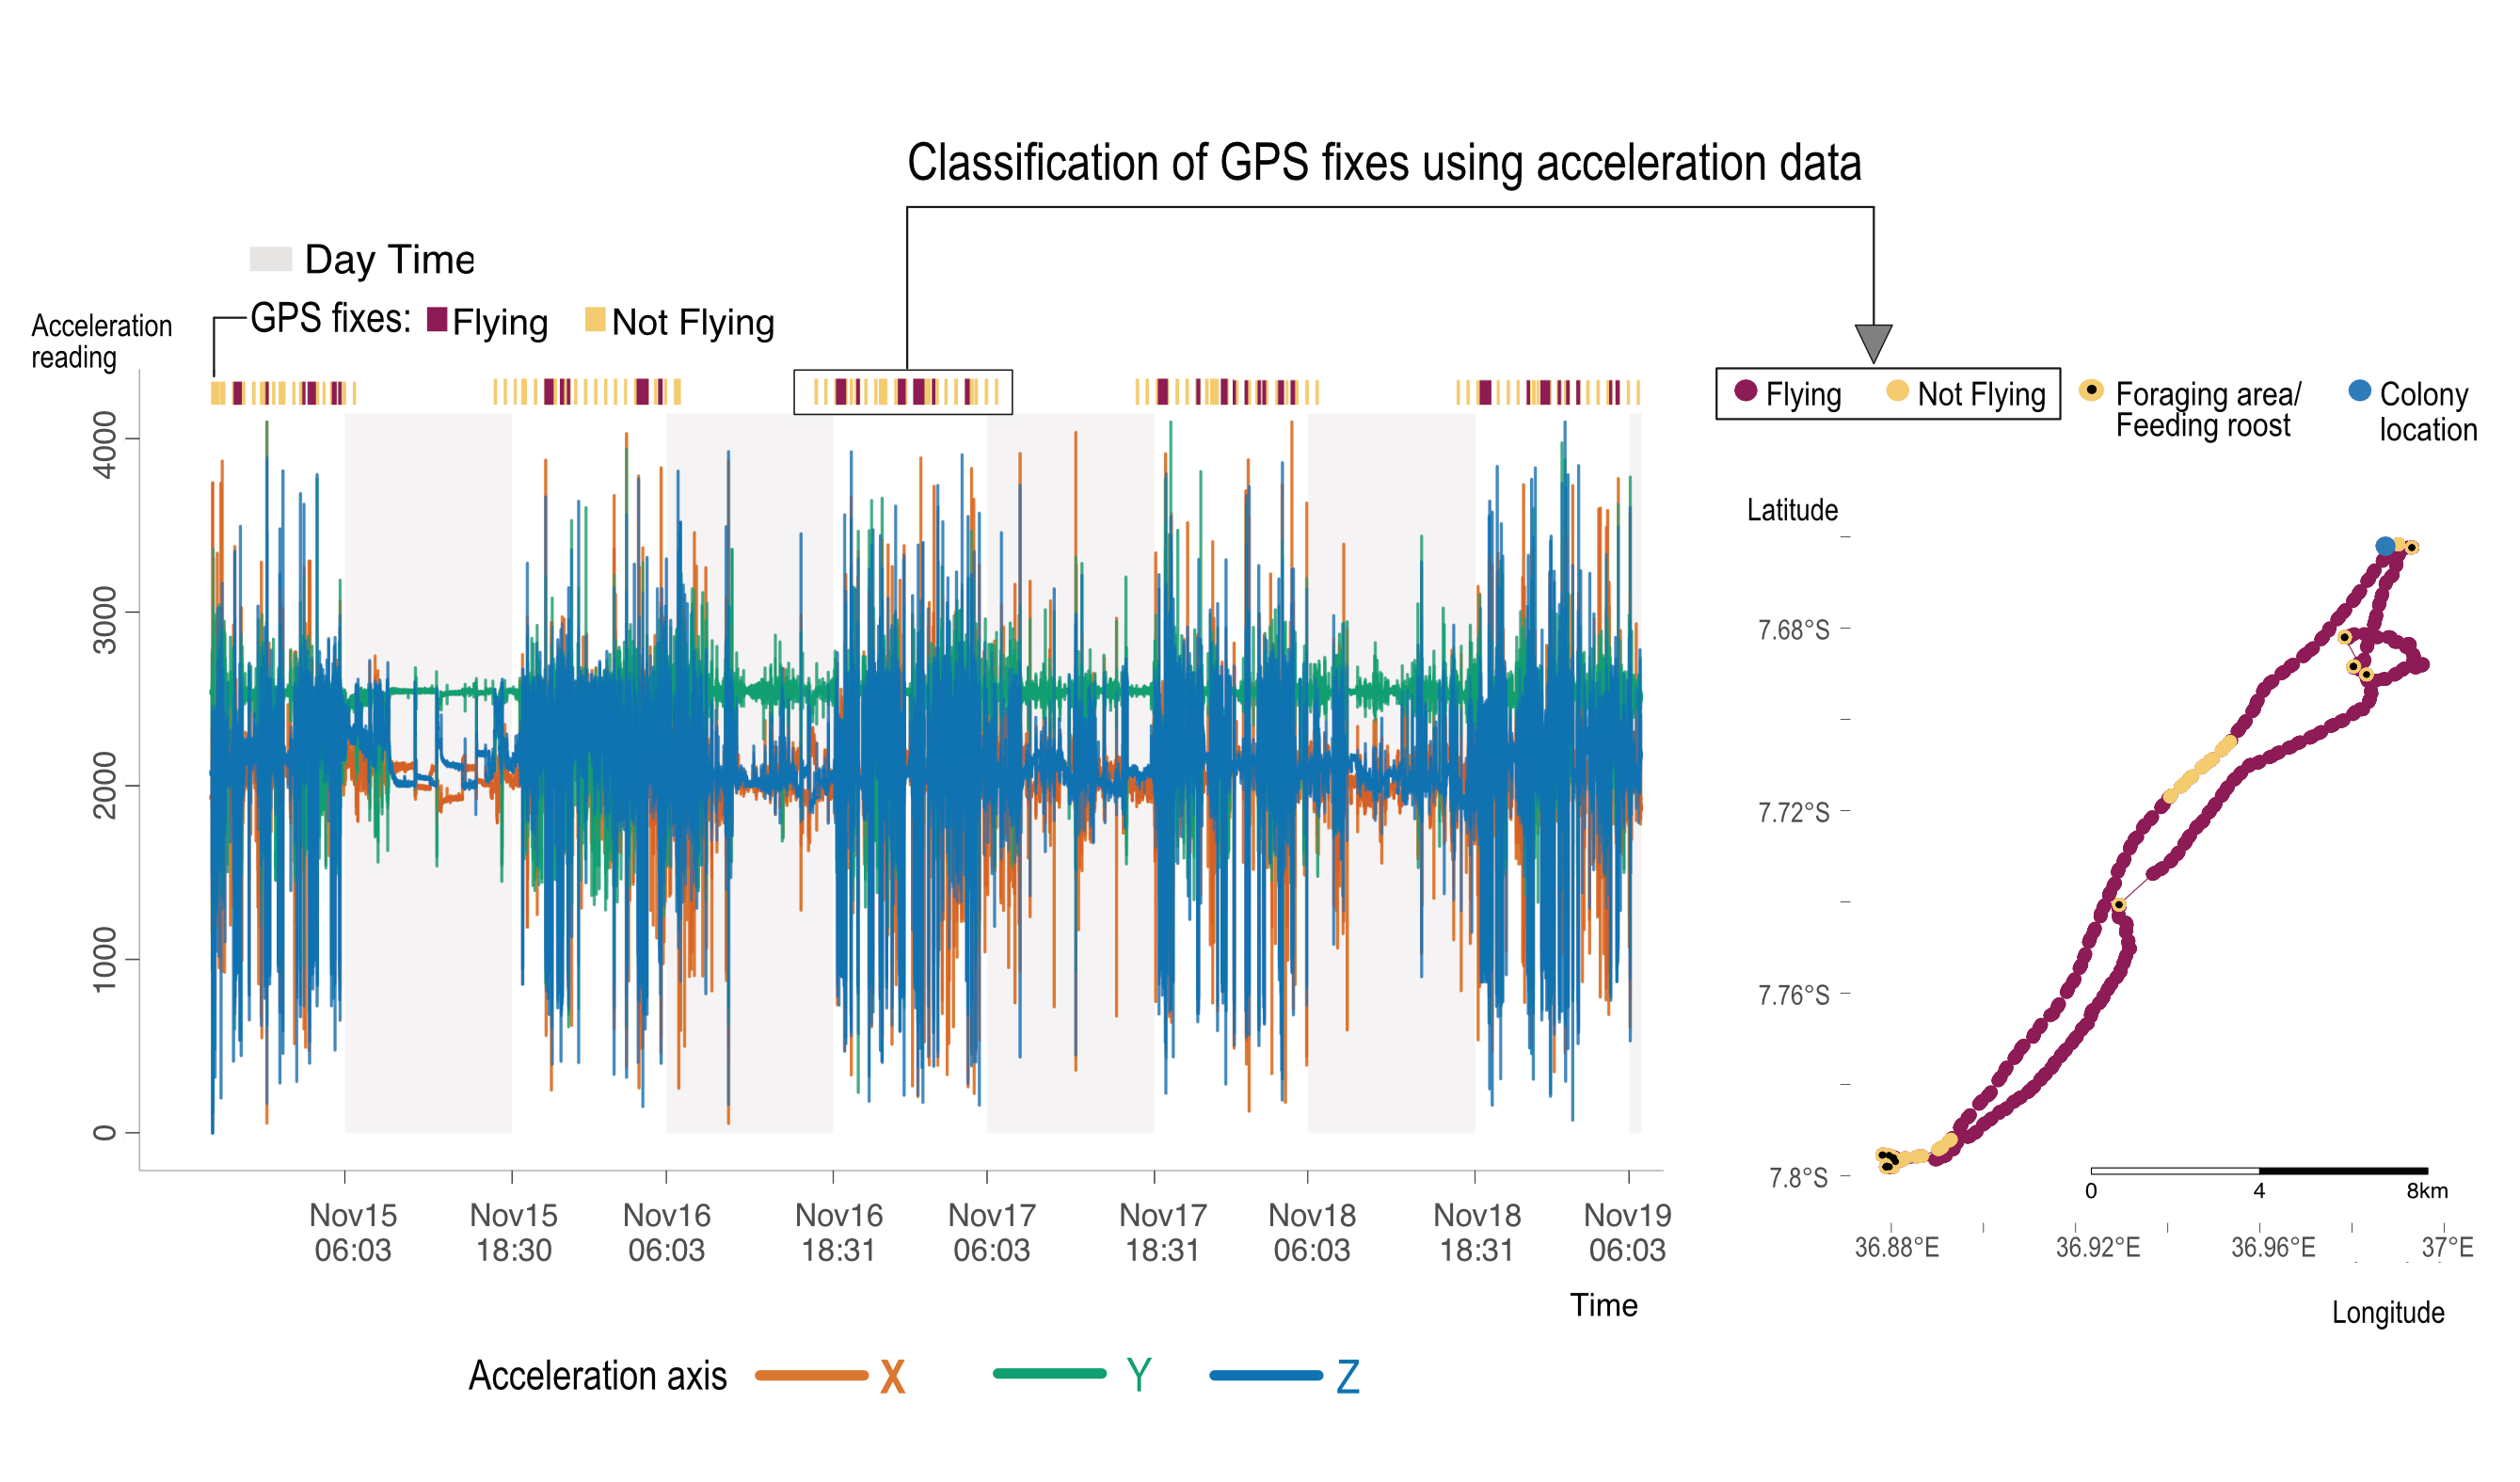
Conveying classification of acceleration data collected from bats and how it is used to categorize bat activity (flying or not). An example track is presented to visualize assigned categories, in addition to foraging and colony roosts. An interactive version of the acceleration plot can be seen at https://nistara.github.io/Tanzania-fruit-bat-study/docs/interactive_plots/K5309.html
Paper Code
Network analysis
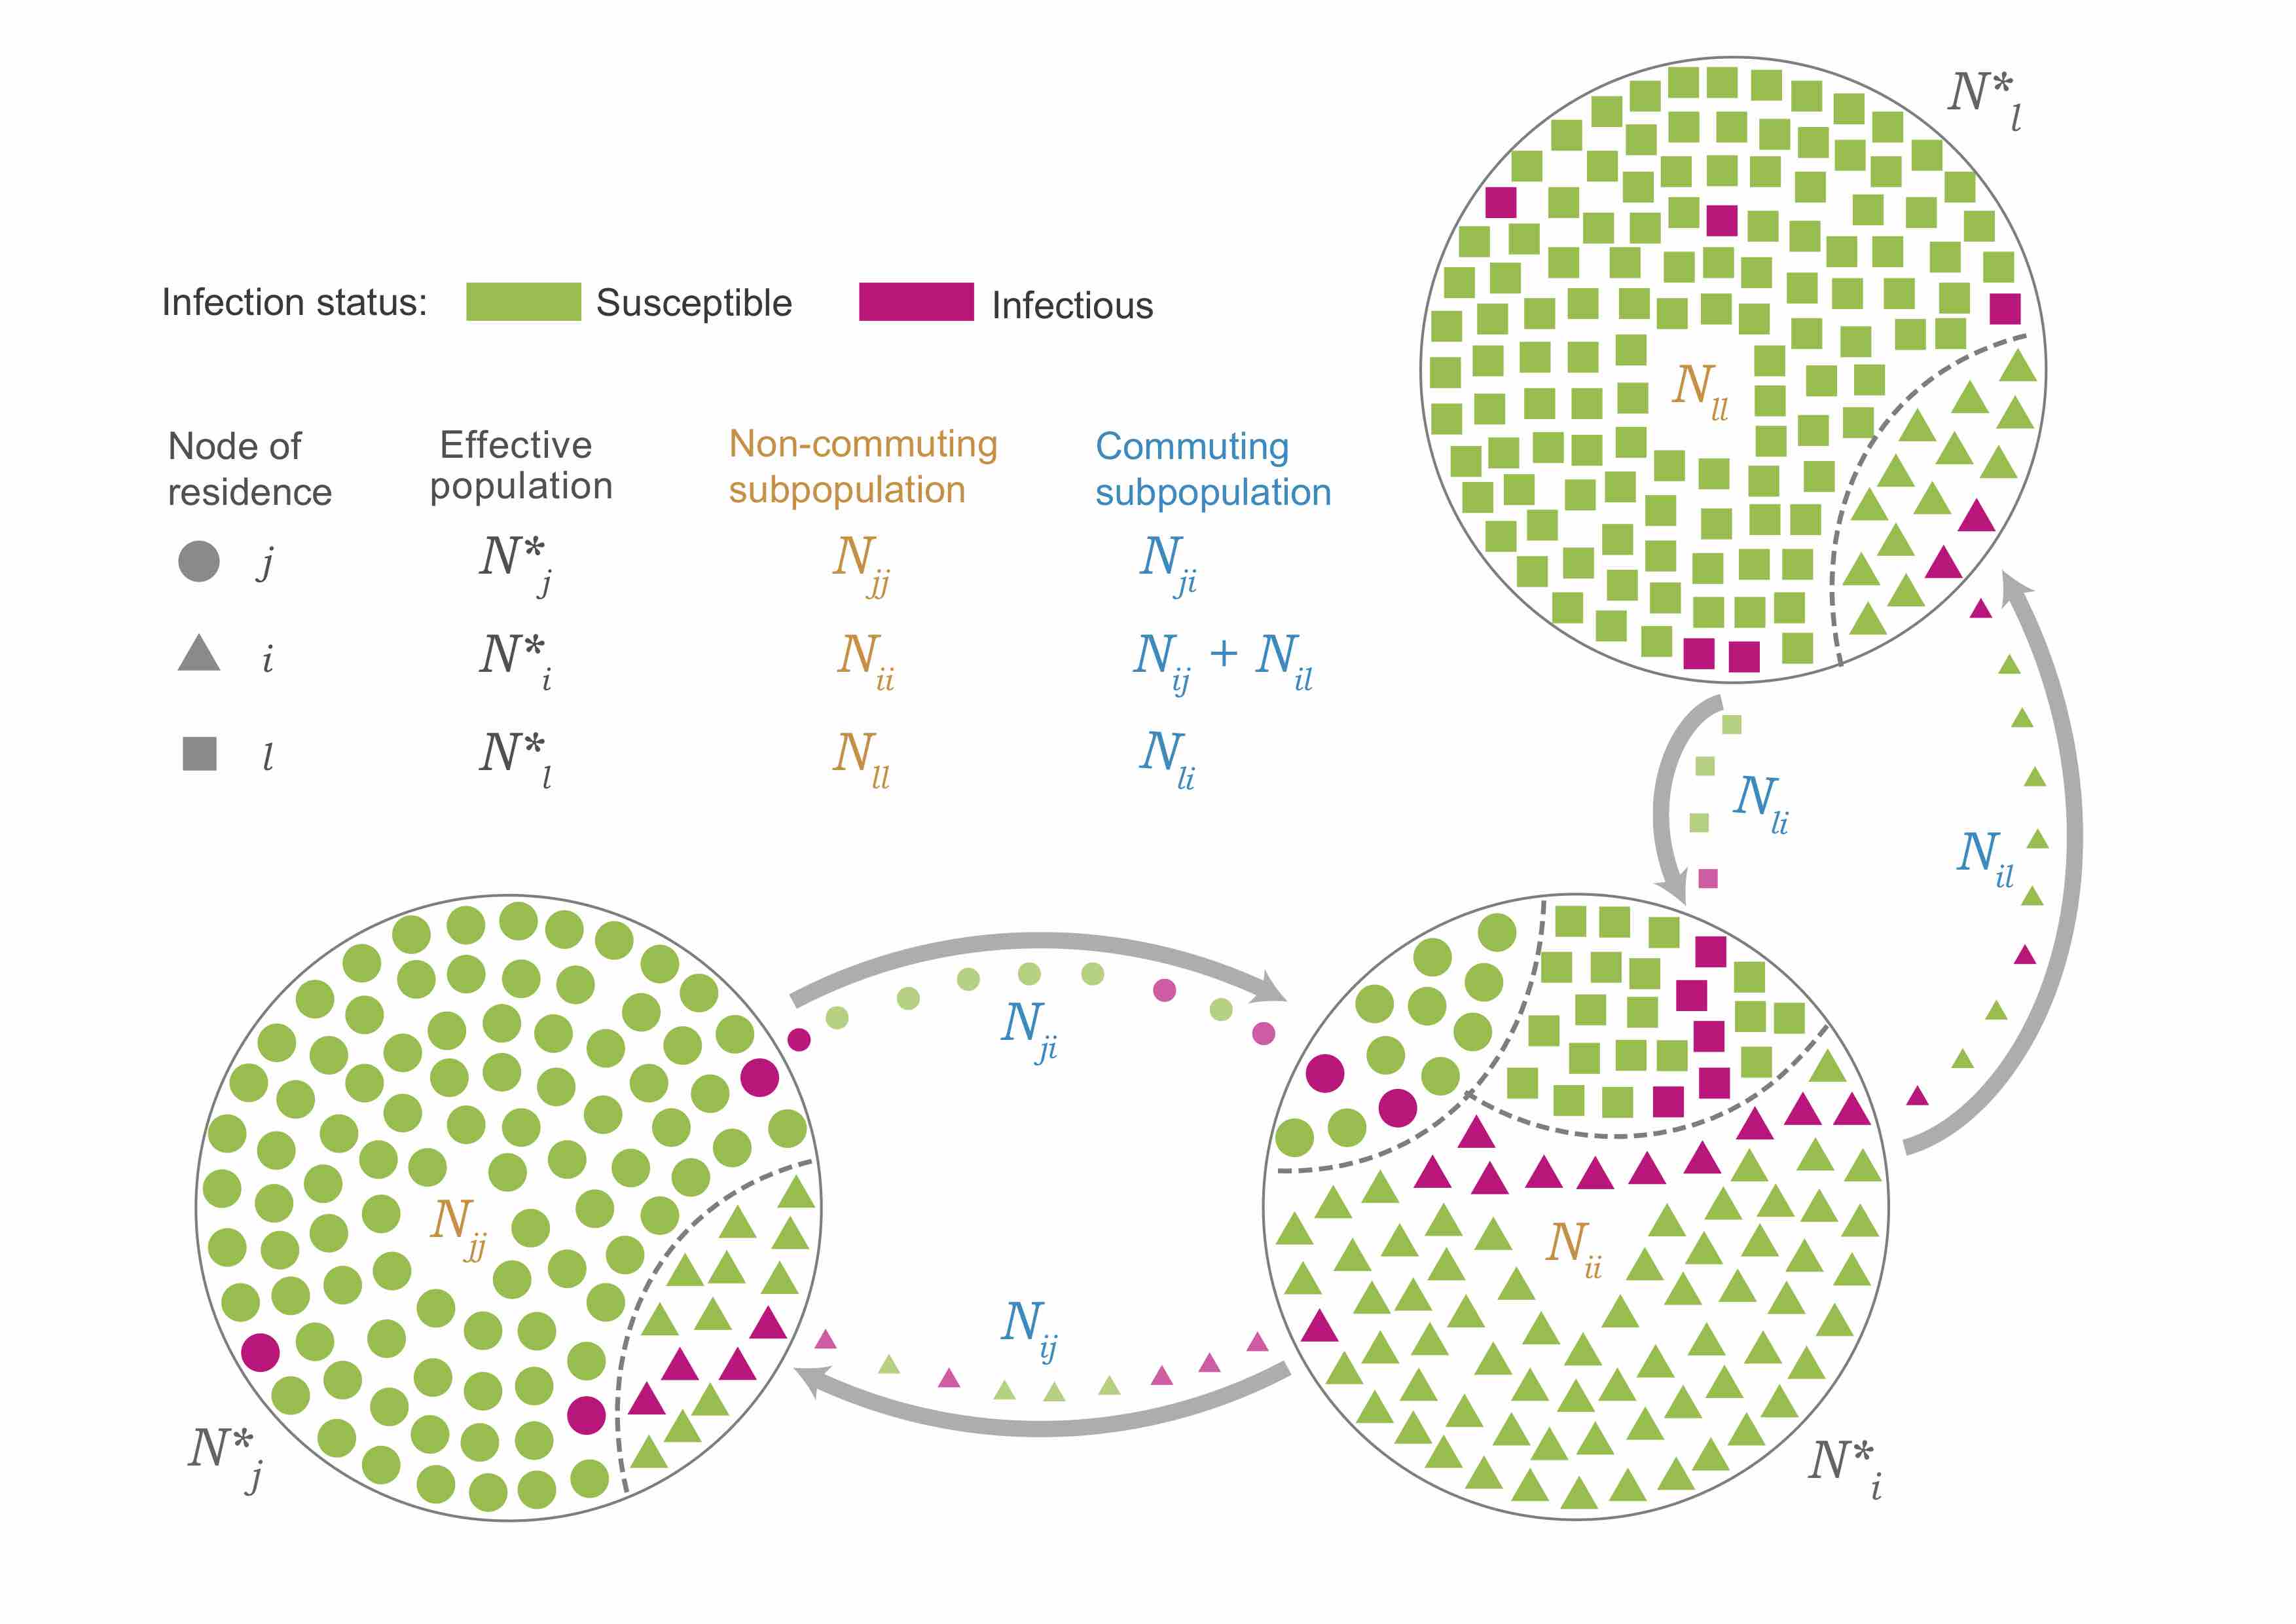
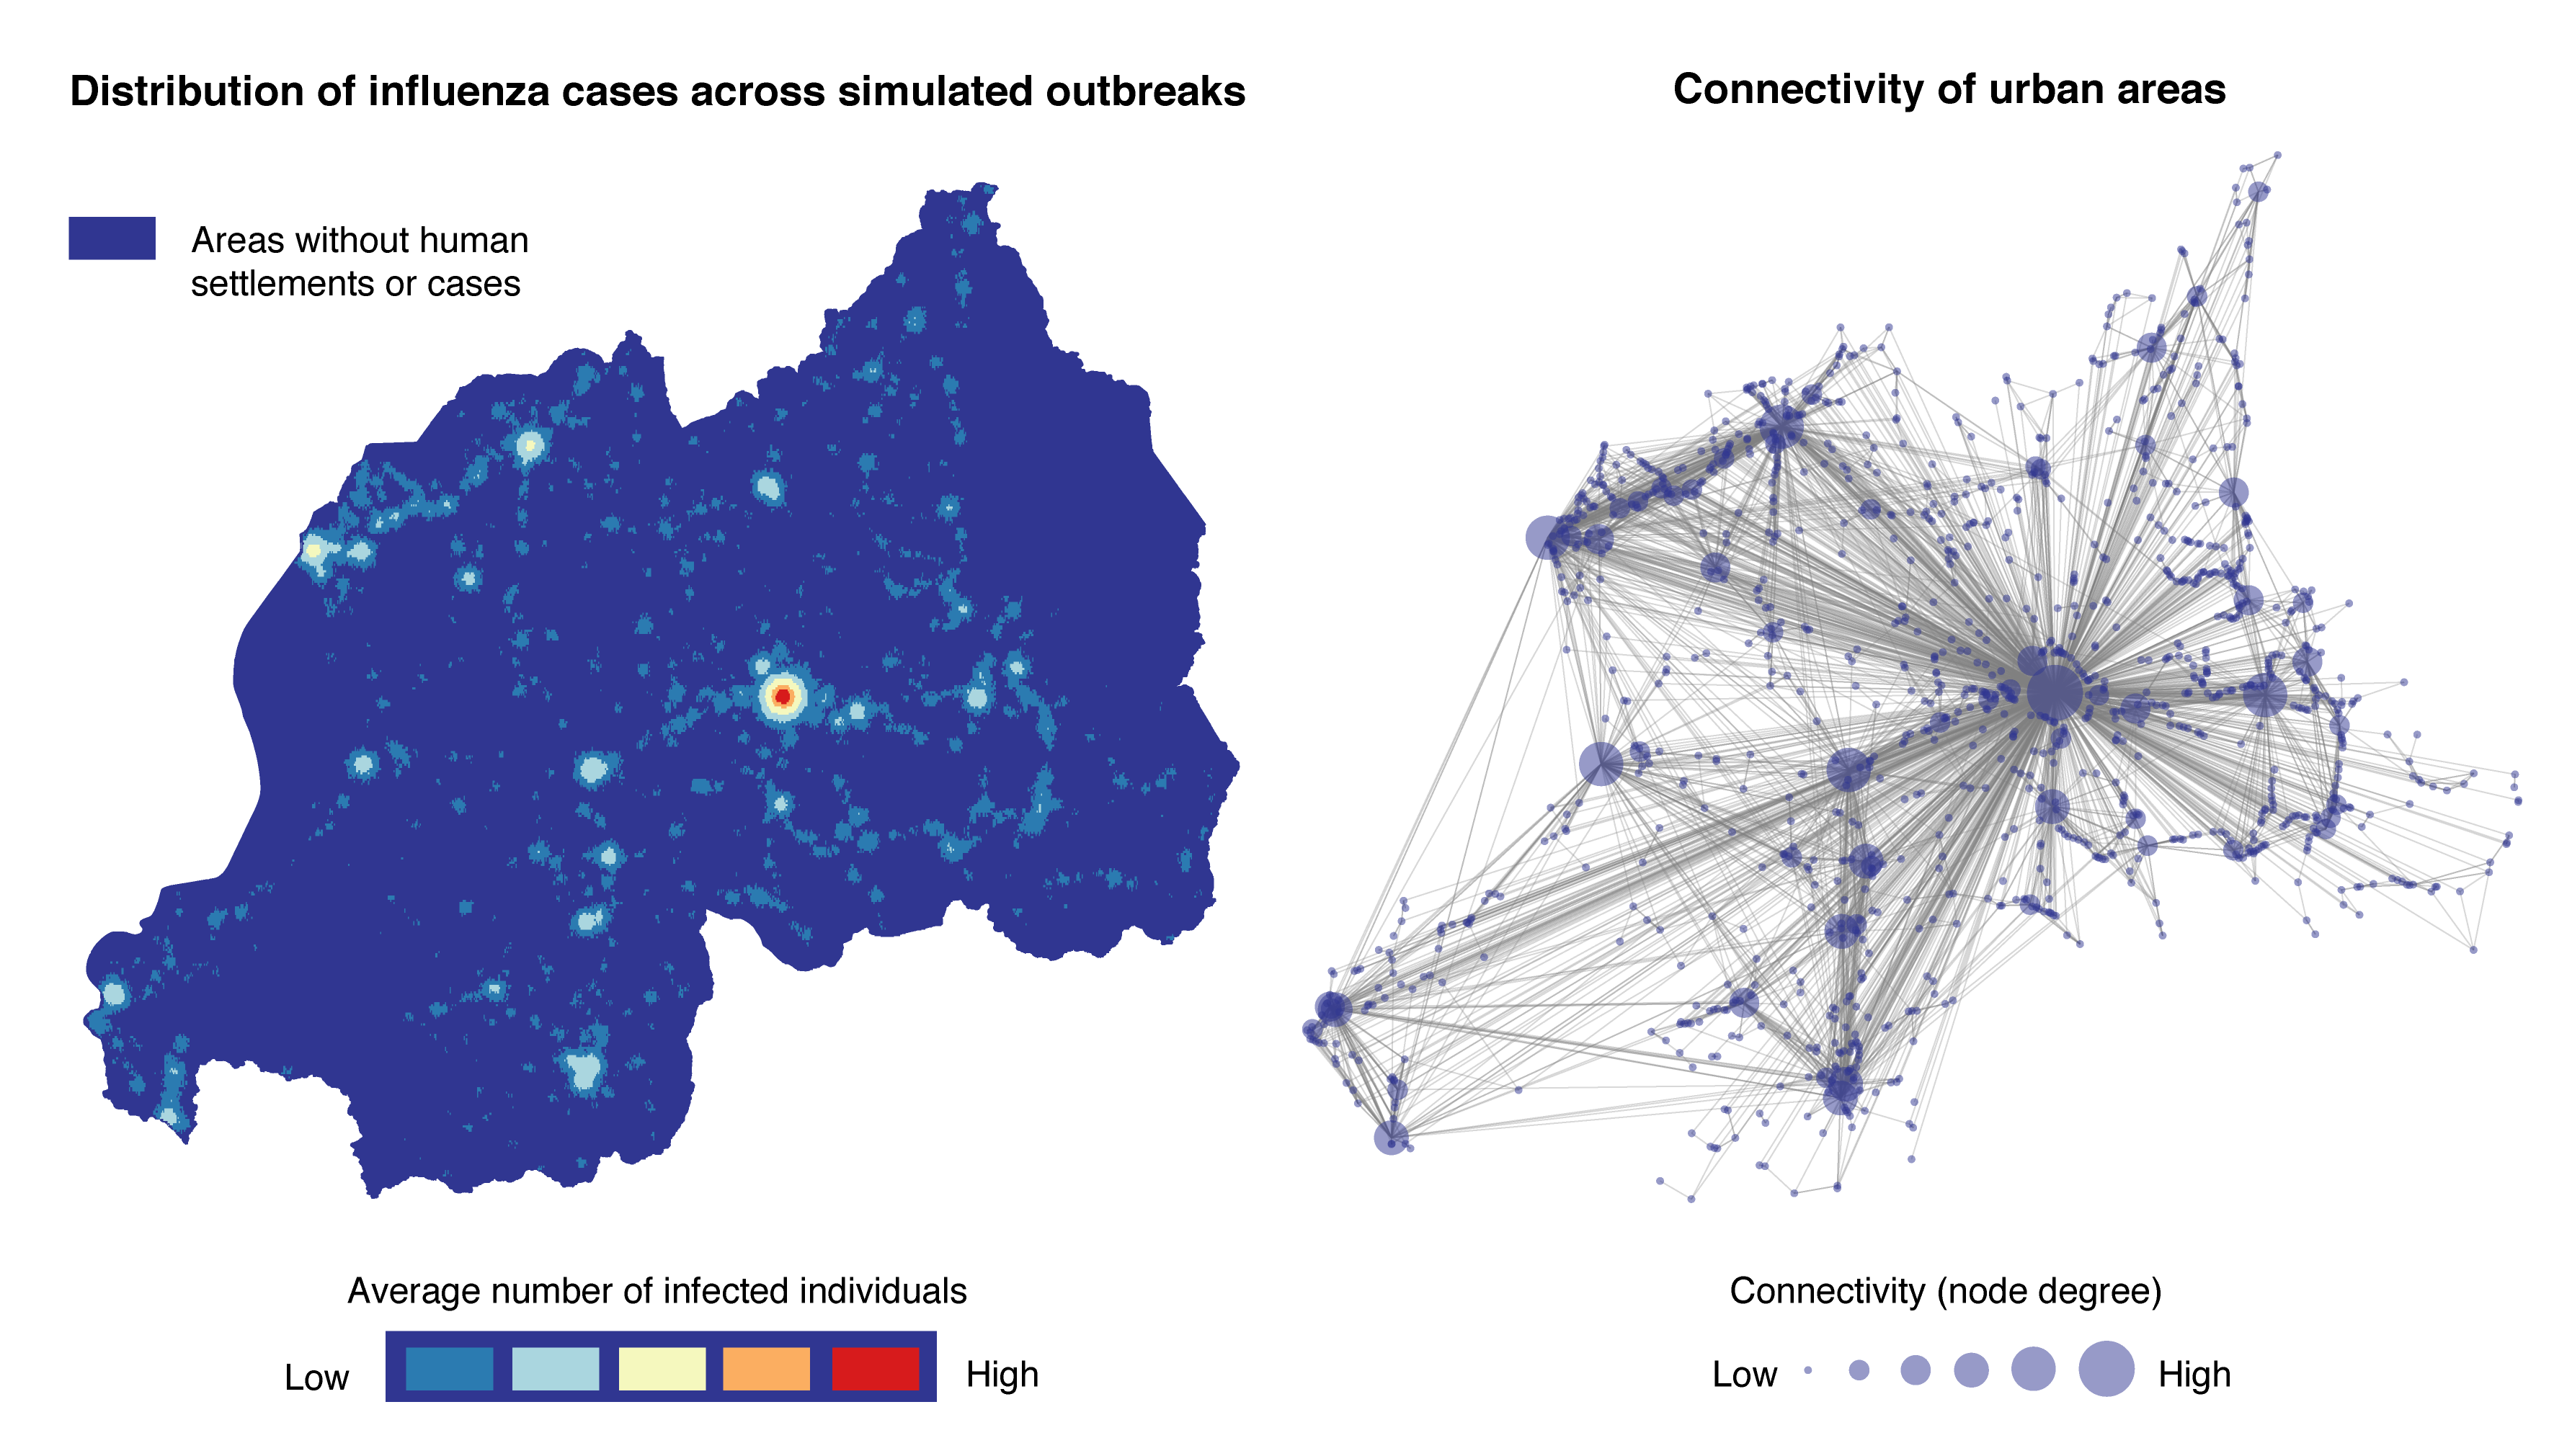
Schematic figure showing commuting flows between different populations and the resultant effective population in a location given outgoing and incoming individuals (and their disease status).
Tanzania bat tracking
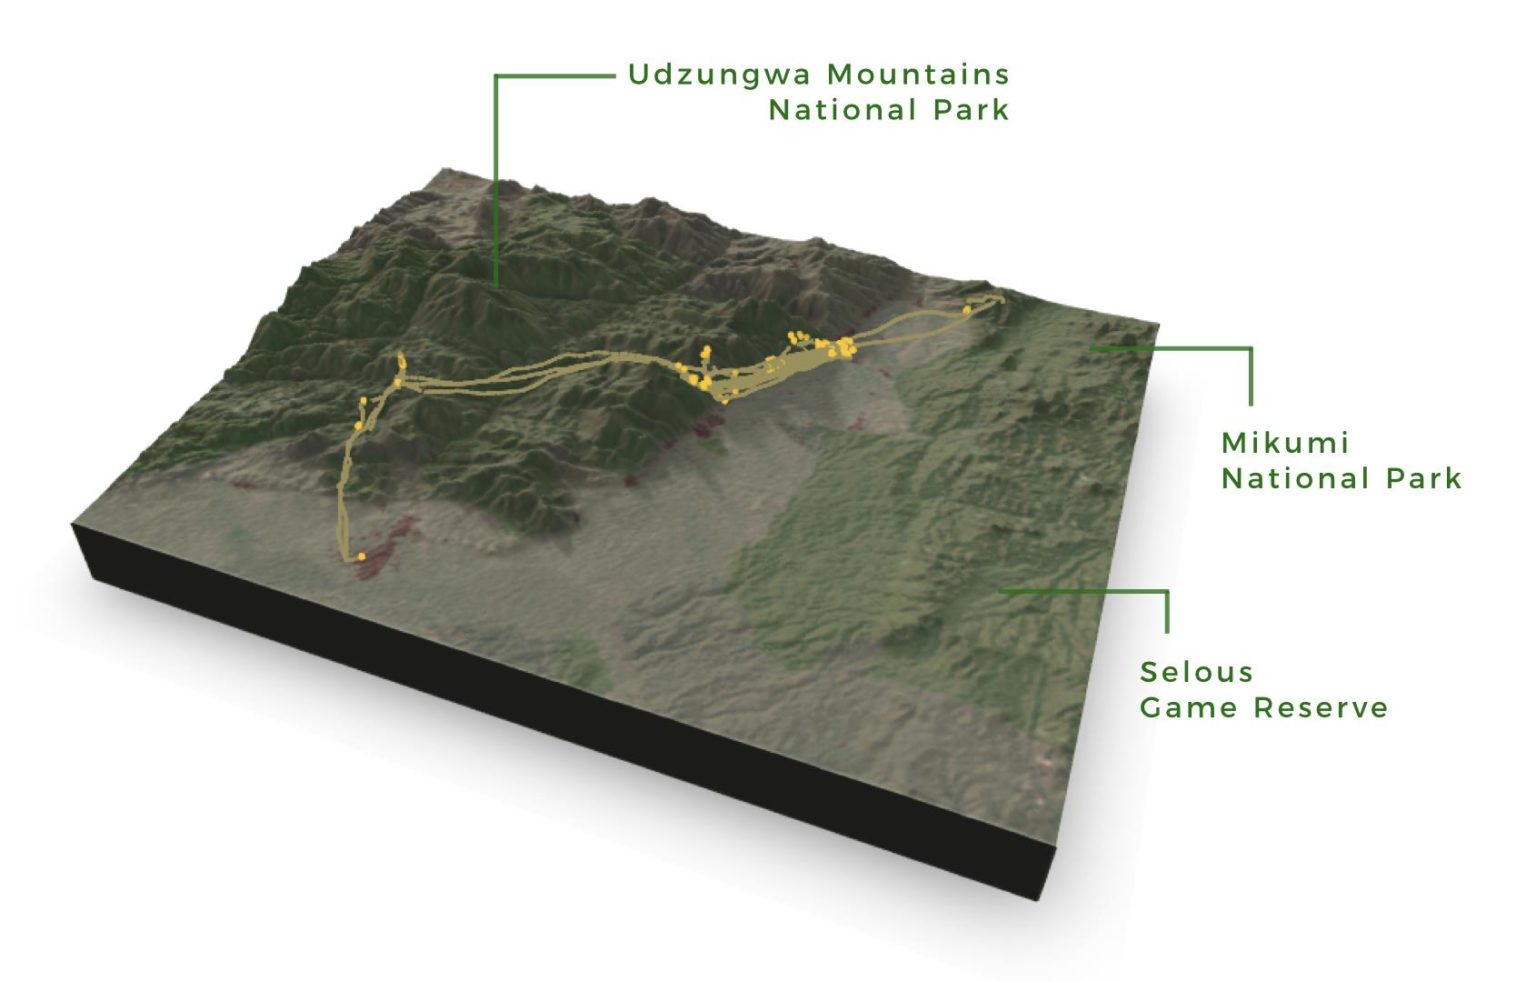
3D map made with the help of the R rayshader package. It is helpful in showing the flight path of a bat across protected areas (Udzungwa Mountains National Park) with higher elevations.
One Health metrics
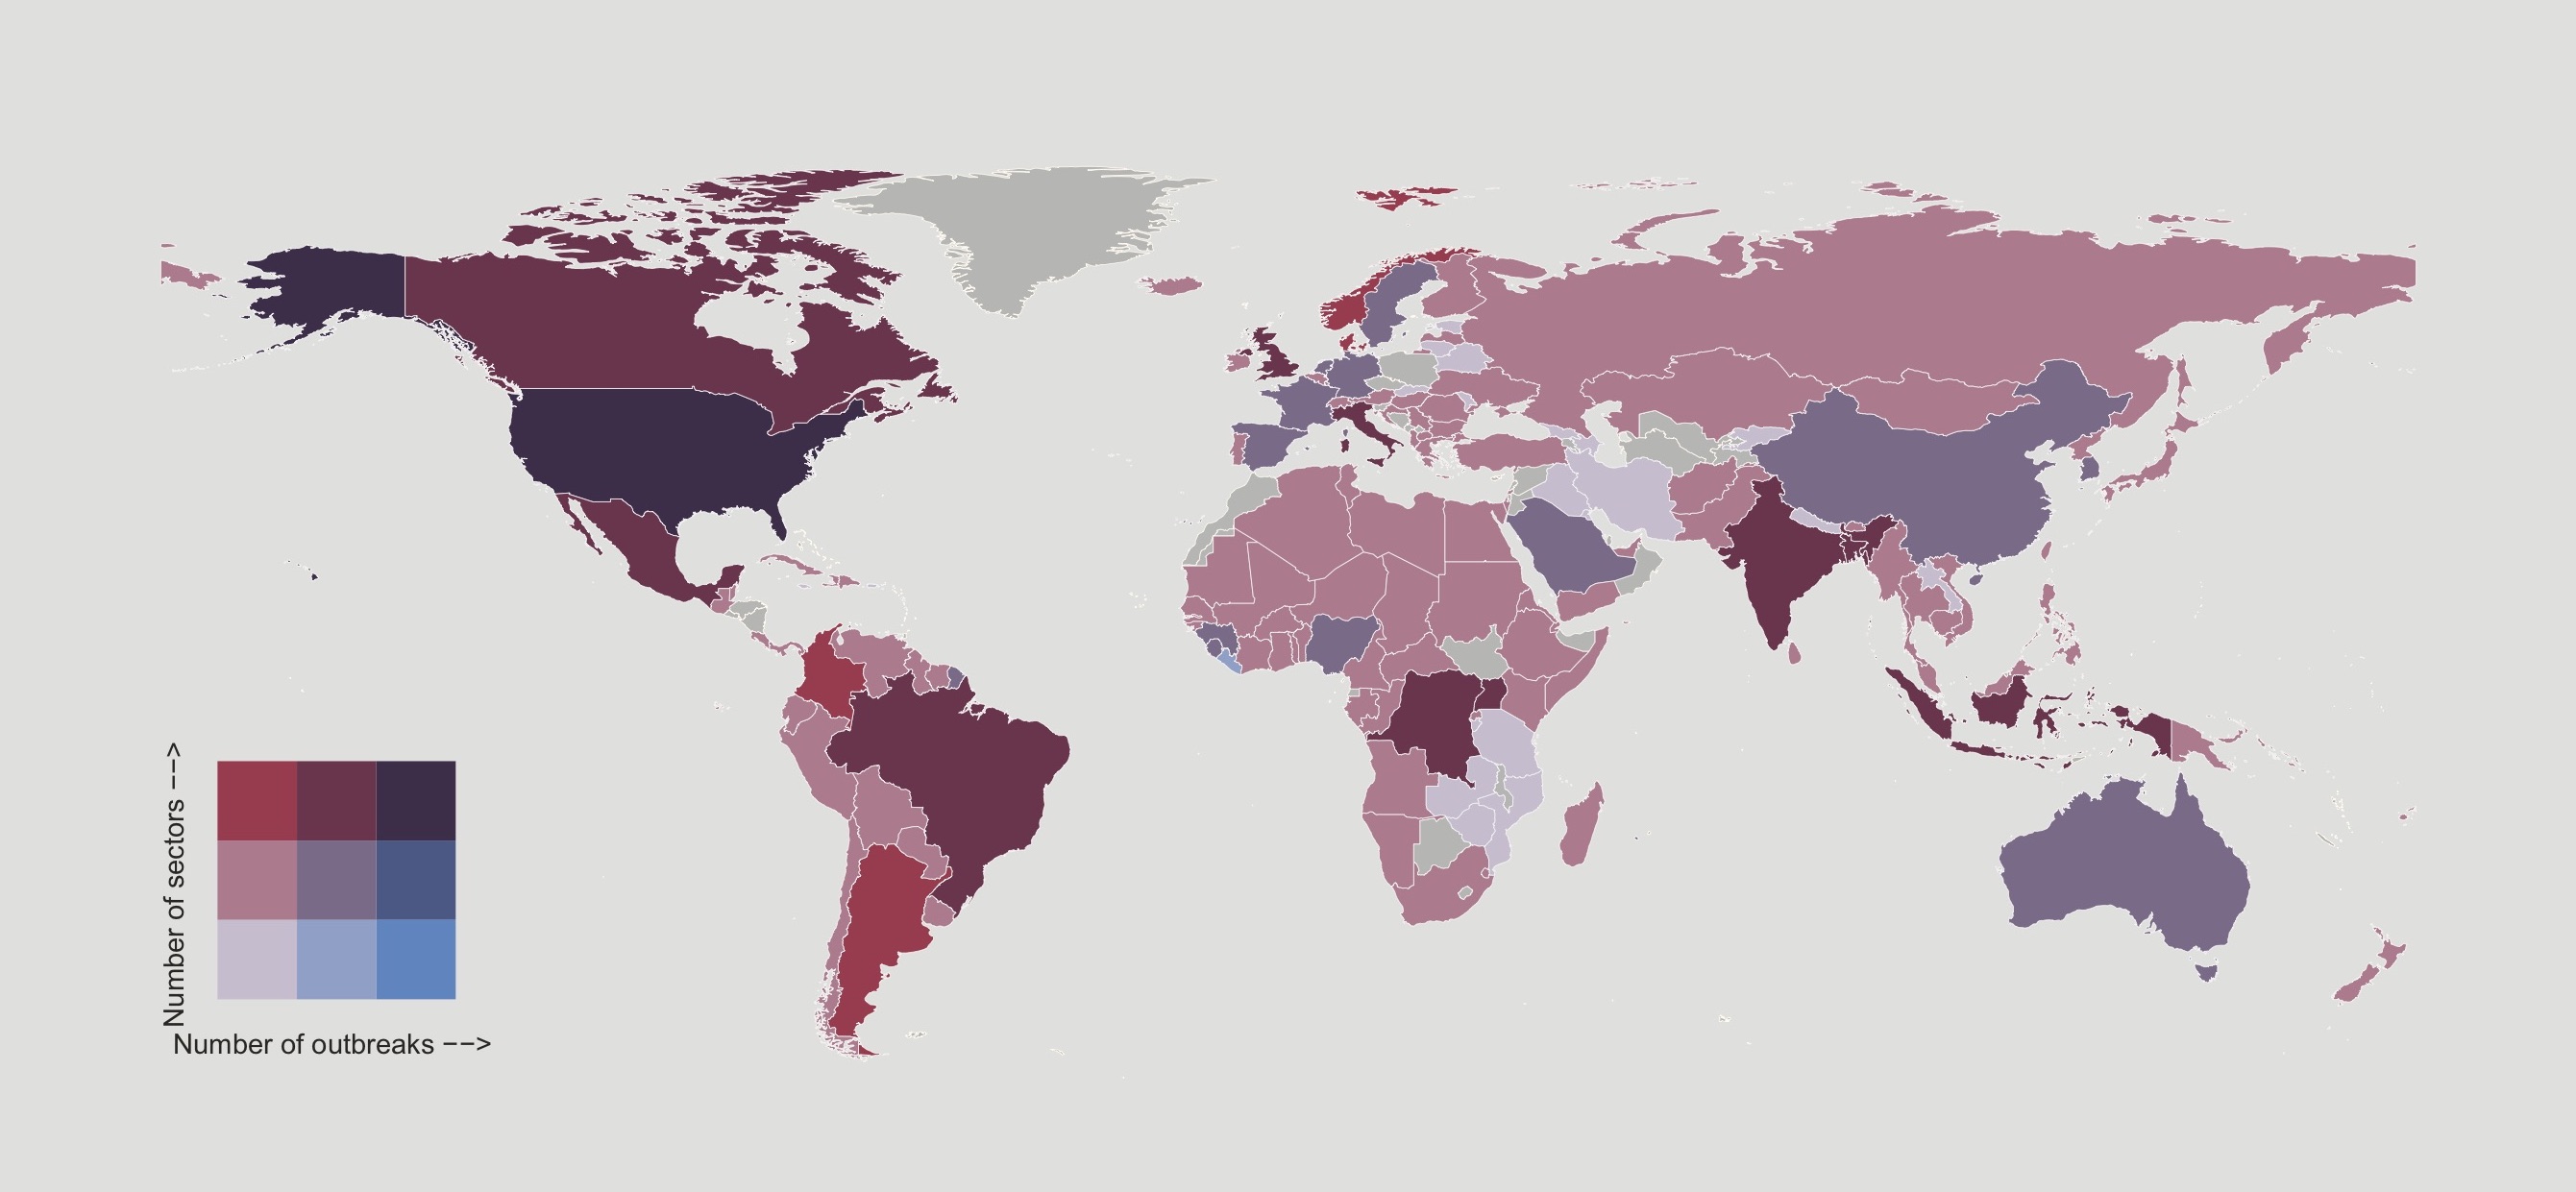
Bivariate map for a One Health timeliness metrics paper which has just been accepted for publication.
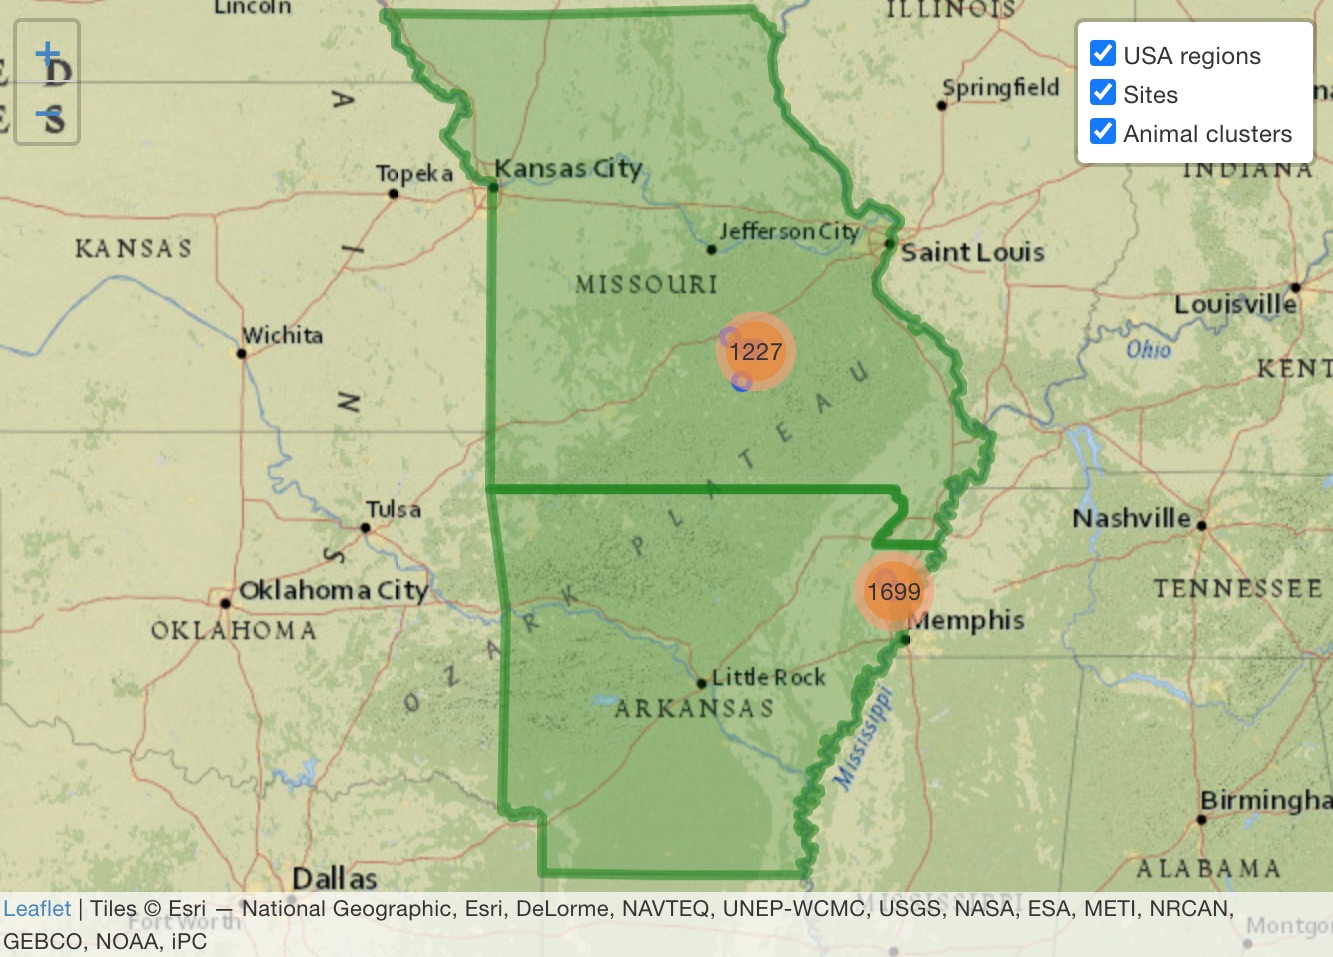
Interactive mapping
Interactive maps made with the R leaflet package. I find these kinds of maps helpful for both exploring and communicating geospatial data.
![]()
Code to generate the above display cards
The requirement
The above image and supporting text displays are generated with Bootstrap (an HTML, CSS and JavaScript Library). Each visualzation needs around 10 lines of html code. For e.g., the html code for the first visualization is:
<div class="card-columns">
  <div class="card mb-3">
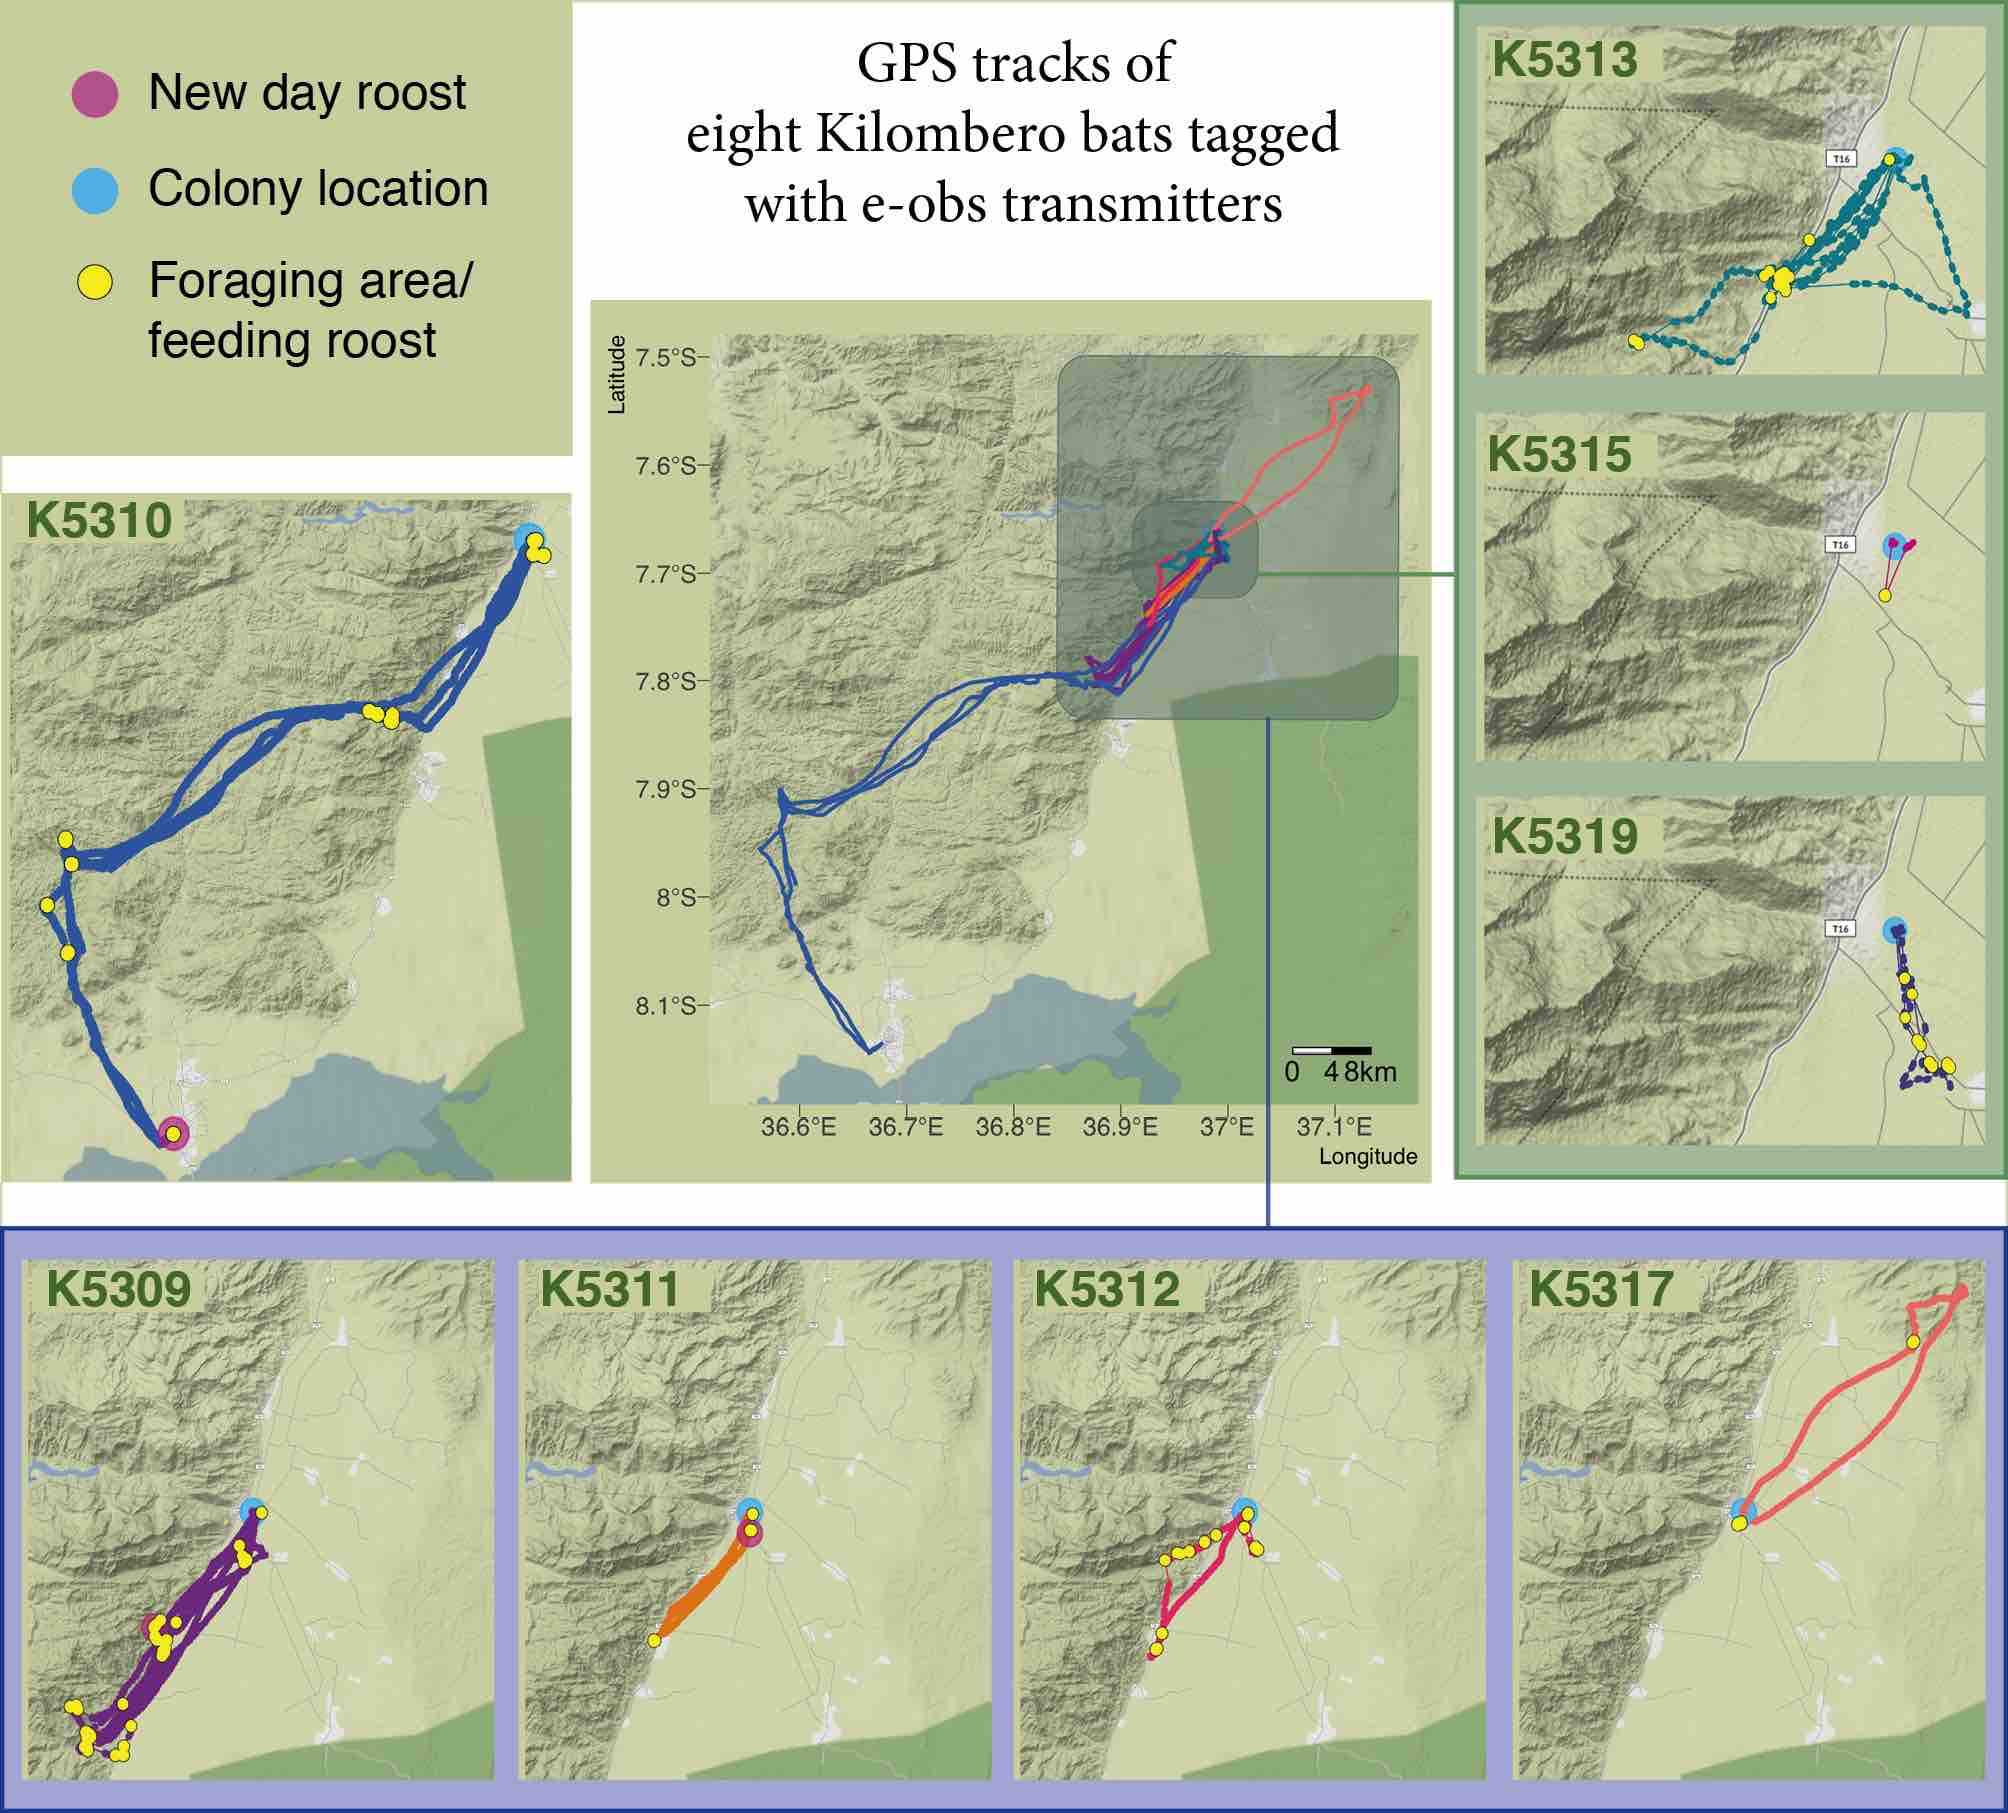
  <img src="/images/data-viz/bat-track_Figure2_gps_maps_all.jpg" class="card-img-top" alt="..." title="Map showing tracks of multiple bats which also visually groups bats by the distance flown by them while keeping the map extent same within groups. This allows for easier visualization of individual tracks while enabling comparizon between them.">
  <div class="card-body">
  <h3 class="card-title">Tanzania bat tracking</h3>
  <p class="card-text">Map showing tracks of multiple bats which also visually groups bats by the distance flown by them while keeping the map extent same within groups. This allows for easier visualization of individual tracks while enabling comparizon between them.</p>
  <a href="https://doi.org/10.1186/s42522-020-00020-9" class="btn">Paper</a>
  <a href="https://nistara.github.io/Tanzania-fruit-bat-study/" class="btn">Code</a>
  </div>
  </div>
</div>
The problem
If there are 10 images, a 100 lines of code will need to be written and this manual addition and editing process can get time consuming and error prone, especially if changes need to be made and more images need to be added/removed.
The solution
Automate the html script generation process with R. I compiled the visualization-specific details into a csv file and wrote R code to generate html script for each image. This process is now separate from image-specific details, and now it's easier to make changes to image information or add/remove images without manually editing any code.
CSV
R Script
info = read.csv("post/data/data-viz/data-viz_info.csv")
info = info[ info$include, ]
info$image_src = paste0(info$image_loc, info$image_name)

block = '
  <div class="card mb-3">
  <img src="%s" class="card-img-top" alt="..." title="%s">
  <div class="card-body">
  <h3 class="card-title">%s</h3>
  <p class="card-text">%s</p>
  <a href="%s" class="btn">%s</a>
  <a href="%s" class="btn">%s</a>
  </div>
  </div>
'

block = block |>
  sprintf(info$image_src, info$caption,
        info$title,
        info$caption,
        info$link1_url, info$link1,
        info$link2_url, info$link2) |>
  gsub(pattern = '<a href=\"\" class=\"btn\"></a>',
     replacement = '\n')

cat('\n')
cat('<div class="card-columns">')
cat(block)
cat('</div>')
cat('\n')
Image of Common Murre by rawpixel.com